My Portfolio
Smart Data Tools and Dashboards in My Portfolio
I Create Smart Data Tools, Dashboards, and Professional Business Documents
At DataFrame4U, we create **smart data tools and dashboards** to help businesses turn raw data into actionable insights. Our solutions include automated Excel tools, interactive dashboards, and professional business documents designed for clarity and efficiency. Our solutions help businesses save time, reduce errors, and make smarter decisions using accurate data insights. Every tool, dashboard, and document is designed for practical business use.
solutions.

Excel Work
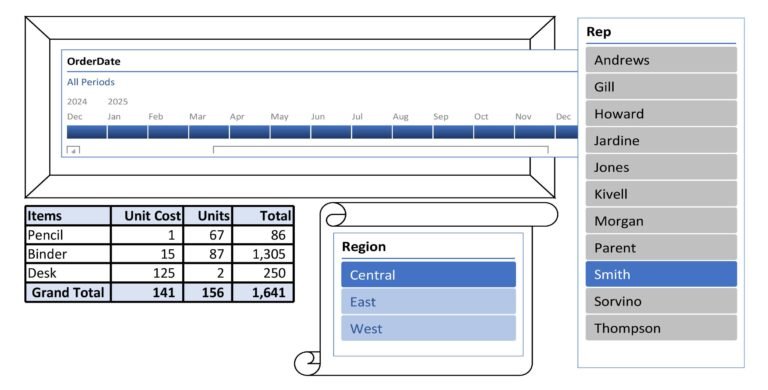
Using **smart data tools and dashboards**, I developed a sales dashboard from the raw data provided by the customer. The dashboard highlights performance across three regions and sales personnel, providing clear region-wise and person-wise comparisons. It enables quick insights into overall sales trends, individual contributions, and regional performance, helping businesses make better data-driven decisions.
decision-making
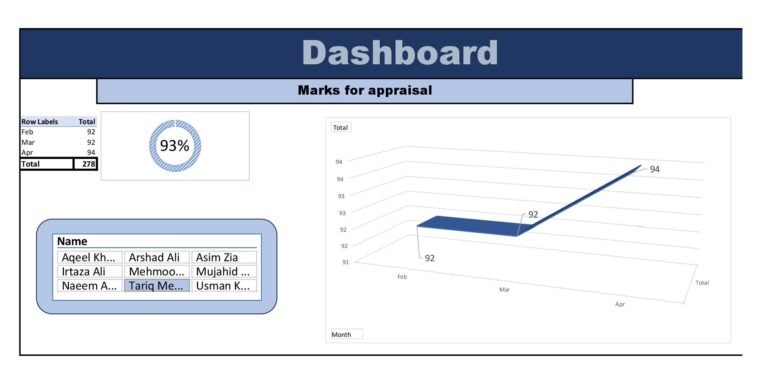
Using **smart data tools and dashboards**, this dashboard allows you to track and visualize your team’s quarterly performance with ease. You can select any employee to view their monthly performance over three months in an intuitive graph, alongside their overall quarterly average percentage. Gain clear insights into individual and team trends to make informed, data-driven appraisals and performance management decisions.
decisions efficiently
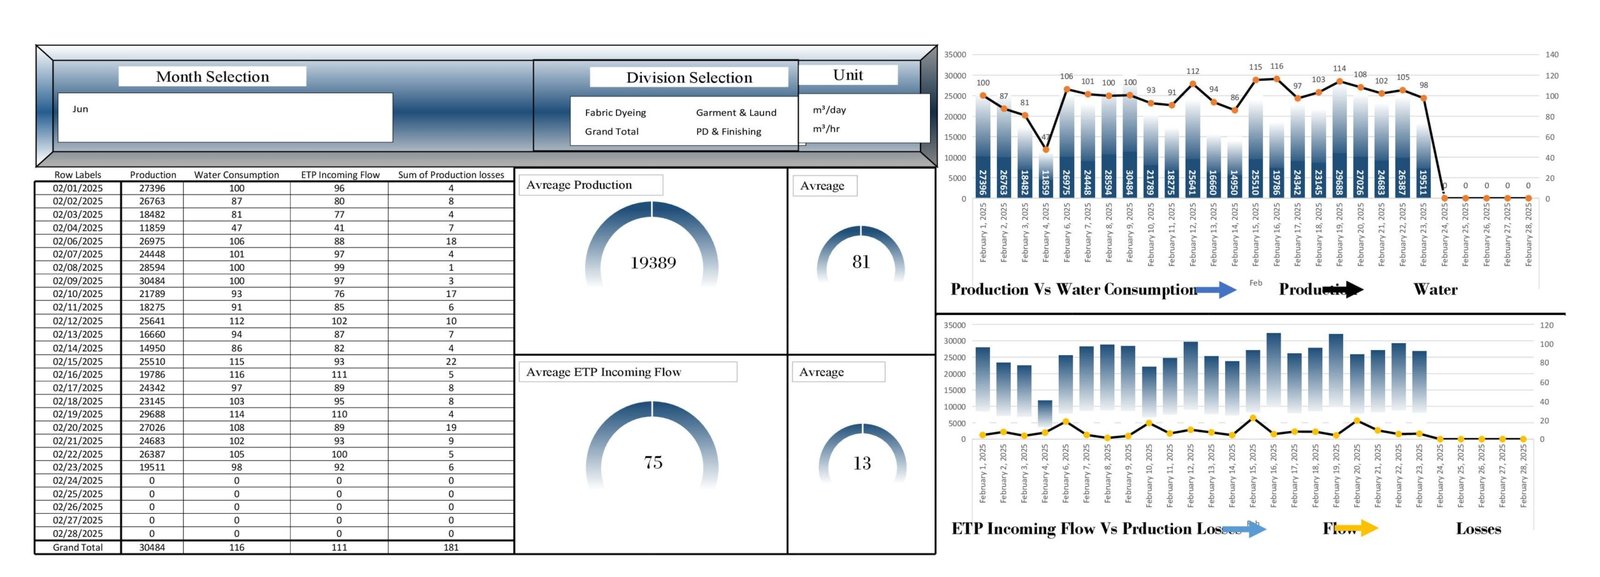
Using **smart data tools and dashboards**, this interactive water performance dashboard presents monthly water data for three departments, highlighting consumption, losses, and efficiency comparisons. Users can filter by month, division, and unit to view average production, average water consumption, liters per kg of production, water losses, and ETP inlet flow. This enables quick monitoring, analysis, and data-driven water management decisions.